Surviving Sub One-Percent Growth — The Choices Facing the Utilities

Coping with Sub-One Percent Growth

Ahmad Faruqui[1]

The Great Recession ended in 2009.  The economic recovery from the recession has been anemic at best.  Some have even argued that there has been no recovery.

This is particularly true for electric utilities.  Some 41 months later, electric sales have not bounced back to their pre-recession levels.  According to Dr John Caldwell of the Edison Electric Institute, electric sales have bounced back on average within five months during the post-war period.  The longest they have ever taken has been twelve months.  So something different is going on this time.  What could that be and what does it mean for the future of electric utility industry? Continue reading

Posted in Uncategorized | Leave a comment

The Water-Energy Nexus in California

Image Credit: http://u.s.kqed.net/2012/06/11/WaterPipeline20120611.jpg

Q: Are these pipelines supplying (a) water, (b) energy, or (c) both?
See bottom for answer.

The water-energy nexus has been in the news since the California Energy Commission’s landmark finding in 2005, that water related energy uses account for about 19% of all electricity use and 30% of non-power plant natural gas use in the state. Continue reading

Posted in Energy, Energy Efficiency, Renewable Energy | Tagged , , , , , , , , | 1 Comment

Residential Rates Revisited – Part 3: Legislative Fixes

In Part 1 of this series was a brief retrospective of some of the antecedents of today’s discussion of residential rates in California.  In Part 2, we discussed in more detail the concept of inclining block rates, the policy rationale behind them, and how residential electricity rates look today in California. In the third and final part of this series we will discuss legislative actions to address residential rates.

Increasing Upper Tier Rates and SB 695

In Part 2, we left off with a look at the current residential rate structure for San Diego Gas & Electric customers.  With increases in costs allocated to the upper tiers until the Department of Water Resources bonds are recovered, the upper tiers have grown significantly to the point where the average rates for the upper two tiers are nearly double that of the lower two tiers. Continue reading

Posted in Energy | Tagged , , , | Leave a comment

Residential Rates Revisited – Part 2: Inclining Block Rates

Part 1 of this series provided a brief retrospective of some of the antecedents of today’s discussion of residential rates in California. We discussed AB 1x and its role in capping rates for consumption below 130% of baseline, we defined baseline, and saw an example of baseline allowances from San Diego Gas & Electric (SDG&E).  In the previous entry, we left off right when the California Public Utilities Commission adopted a 5-tier, inclining block structure for residential electricity rates [D.01-09-059, D.01-05-064].  In Part 2, we will discuss in more detail the concept of inclining block rates, the policy rationale behind them, and how residential electricity rates look today in California as a result of this policy. Continue reading

Posted in Energy | Tagged , , | 1 Comment

Residential Electric Rates Revisited – Part 1: A Historical Perspective

Residential rates always seem to be in the news for one reason or another.  These days, residential rates are the subject of pending legislation (AB 327) and an ongoing rulemaking at the California Public Utilities Commission (CPUC) (R.12-06-013). To help add some context to the discussion, we will be writing a series of blog posts to address the history of how we got the current residential rate structure, a bit about the inclining block structure (tiered rates) that we have today, and some of the outcomes of the current residential rate structure and legislative action to address residential rates. Continue reading

Posted in Energy | Tagged , , , , | 4 Comments

Induced Hydraulic Fracturing (Fracking) – Background and Pending Legislation

This post provides a general background on fracking technology, the related environmental and safety concerns, and pending legislation. In an upcoming post, we’ll address the issues surrounding the vast Monterey shale deposit in California.

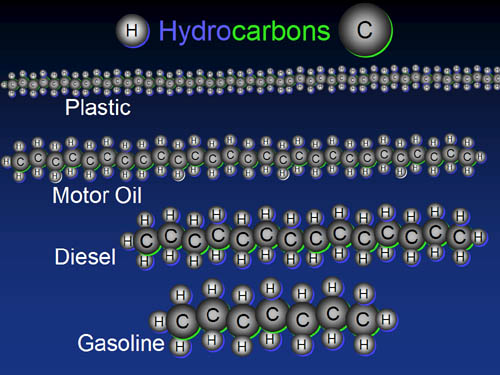
Induced hydraulic fracturing, or fracking, is a process in which a highly pressurized fracturing liquid is injected into cracks in rock layers. The energy within the pressurized liquid induces fractures in the rock layers to propagate and grow. The technology has uses in oil and natural gas industries principally because hydrocarbons that would otherwise be inaccessible or not economically viable can be extracted at much higher yield rates.

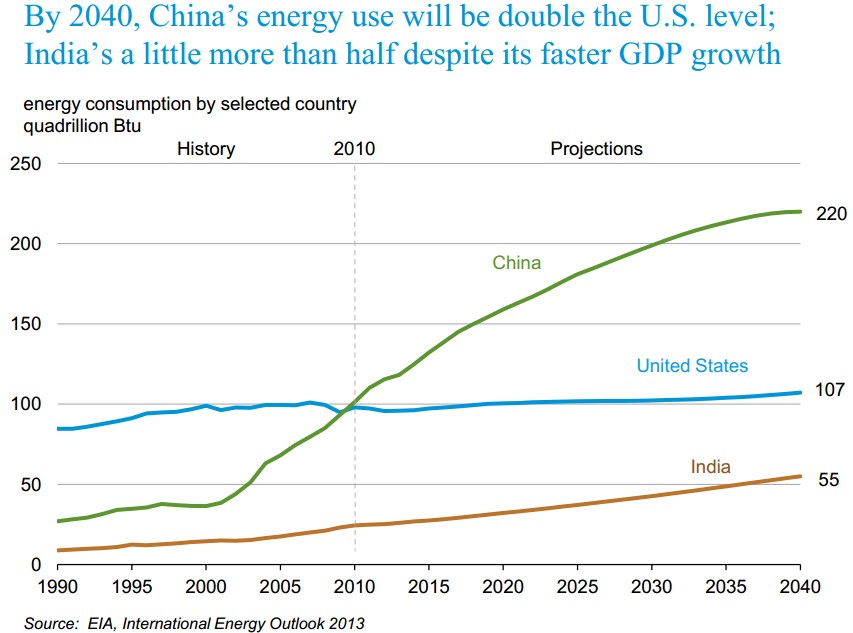
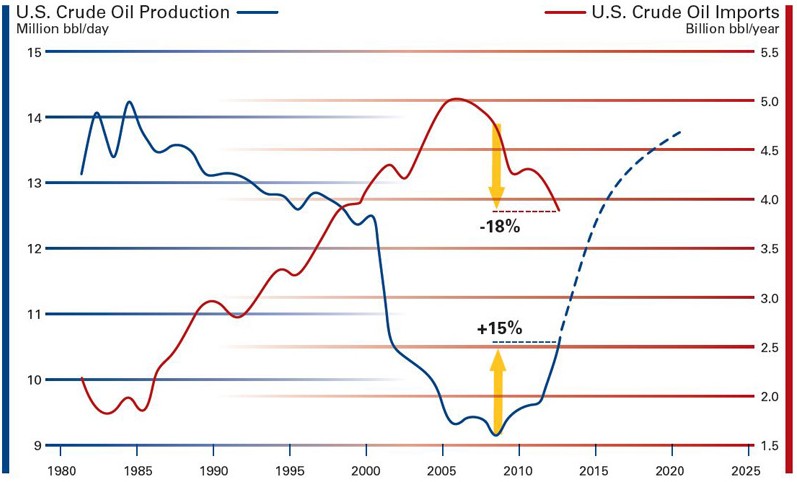
The economic pros of hydraulic fracturing are obvious. The estimated global remaining reservoir of shale gas, tight gas, and coalbed methane, all recoverable via hydraulic fracturing, is roughly 310 trillion cubic meters. As of 2012, the total combined oil reserve of the top seventeen oil-rich countries totaled only 210 trillion cubic meters. Due in large part to hydraulic fracturing operations, current forecasts are that in late 2013, U.S. monthly crude oil productions are expected to exceed imports for the first time since 1995. With global oil demand continually increasing, the vast supply of north American shale gas reserves is expected to provide the U.S. with substantially greater stability in an otherwise extremely volatile global market.

However, obvious economic impacts aside, significant environmental and public health concerns have majorly delayed the proliferation of hydraulic fracturing technology. Continue reading

Posted in Energy, Legislation | Tagged , , | Leave a comment

CEQA Greenhouse Gas Litigation San Diego County

This post summarizes the most important greenhouse gas planning lawsuits initiated in San Diego County and their potential implications for local planning.

In Citizens for Responsible Equitable Environmental Development (“CREED”) v. City of Chula Vista (2011) the City of Chula Vista certified a mitigated negative declaration (MND) and approved development permits for a project that would demolish existing buildings and replace them with a larger and more energy efficient building. The trial court denied the petition for a writ of mandate that the City should have prepared an environment impact report instead of an MND. Upon appeal, the California 4th Court of Appeal rejected arguments about insufficiency of greenhouse gas analyses but remanded the case to the trial court for other reasons. The court upheld the lead agency’s discretion to select the appropriate threshold for evaluating a project’s greenhouse gas (GHG) emissions, provided the threshold decision is supported by substantial evidence. Continue reading

Posted in CEQA, Legislation, Renewable Energy | Tagged , , , , , , , , , , , | Leave a comment

How many pounds of carbon dioxide (CO2) does a gallon of gas produce?

Before answering this question it helps to first know how much a gallon of gasoline weighs.

Gasoline has a weight of just over 6 pounds per US gallon. A natural guess could then be that about 6 pounds of carbon dioxide (CO2) is produced from the combustion of a gallon of gasoline. However, to the surprise of many, that guess would actually be too low.

Gasoline is comprised primarily of carbon and hydrogen atoms linked together forming large carbon chain molecules. During the combustion process, the chemical bonds linking individual carbon atoms together are broken apart, releasing energy that is used to power the vehicle’s engine. When the bond between two carbon atoms is broken, each of those freed carbon atoms then bond naturally with other atoms in the atmosphere, typically oxygen atoms. From this chemical reaction we find the answer to our question.

Image Credit: burnanenergyjournal.com

Image Credit: burnanenergyjournal.com

Continue reading

Posted in Energy, Energy Efficiency, Greenhouse Gas, Transportation | Tagged , , , , , , | 13 Comments

The Real Price of Gasoline

The price of gasoline varies over time and by region, and in many ways affects the lives of the majority of the global population. This post looks at what makes up the price of a gallon of gas and highlights a few of the factors that shape the diversity in price.

Whether the price at the pump has gone up or down depends on the time scale considered and whether one looks at nominal or real dollars (adjusted for inflation). Over a nearly 100 year period (1919-2010) the real price of gasoline at the pump has decreased by about 15%. However, over a shorter period of time (1990-2010) the real price has increased by nearly 45%. The following two charts show how the price of gasoline has fluctuated over both the long-term and short-term timeframes. Continue reading

Posted in Energy, Transportation | Tagged , | 1 Comment

The MPG Illusion

Image Credit: thenextgear.com

Image Credit: thenextgear.com

Assume that you have two cars; an SUV and a compact car. Both cars are aging but you can only afford to replace one. Assume further, that like many families, you still require at least one car with a carrying capacity greater than what a compact car can offer.

From both a fuel economics and an emissions perspective, which is the better option?

(a) Replacing the SUV (15 MPG) with a mid-size sedan (28 MPG)

or

(b) Replacing the compact car (32 MPG) with a hybrid (55 MPG)

Let’s see how both options fare over a 100 mile trip. Continue reading

Posted in Energy, Energy Efficiency, Greenhouse Gas, Renewable Energy, Transportation | Tagged , , , , , | Leave a comment