
The price of gasoline varies over time and by region, and in many ways affects the lives of the majority of the global population. This post looks at what makes up the price of a gallon of gas and highlights a few of the factors that shape the diversity in price.
Whether the price at the pump has gone up or down depends on the time scale considered and whether one looks at nominal or real dollars (adjusted for inflation). Over a nearly 100 year period (1919-2010) the real price of gasoline at the pump has decreased by about 15%. However, over a shorter period of time (1990-2010) the real price has increased by nearly 45%. The following two charts show how the price of gasoline has fluctuated over both the long-term and short-term timeframes.
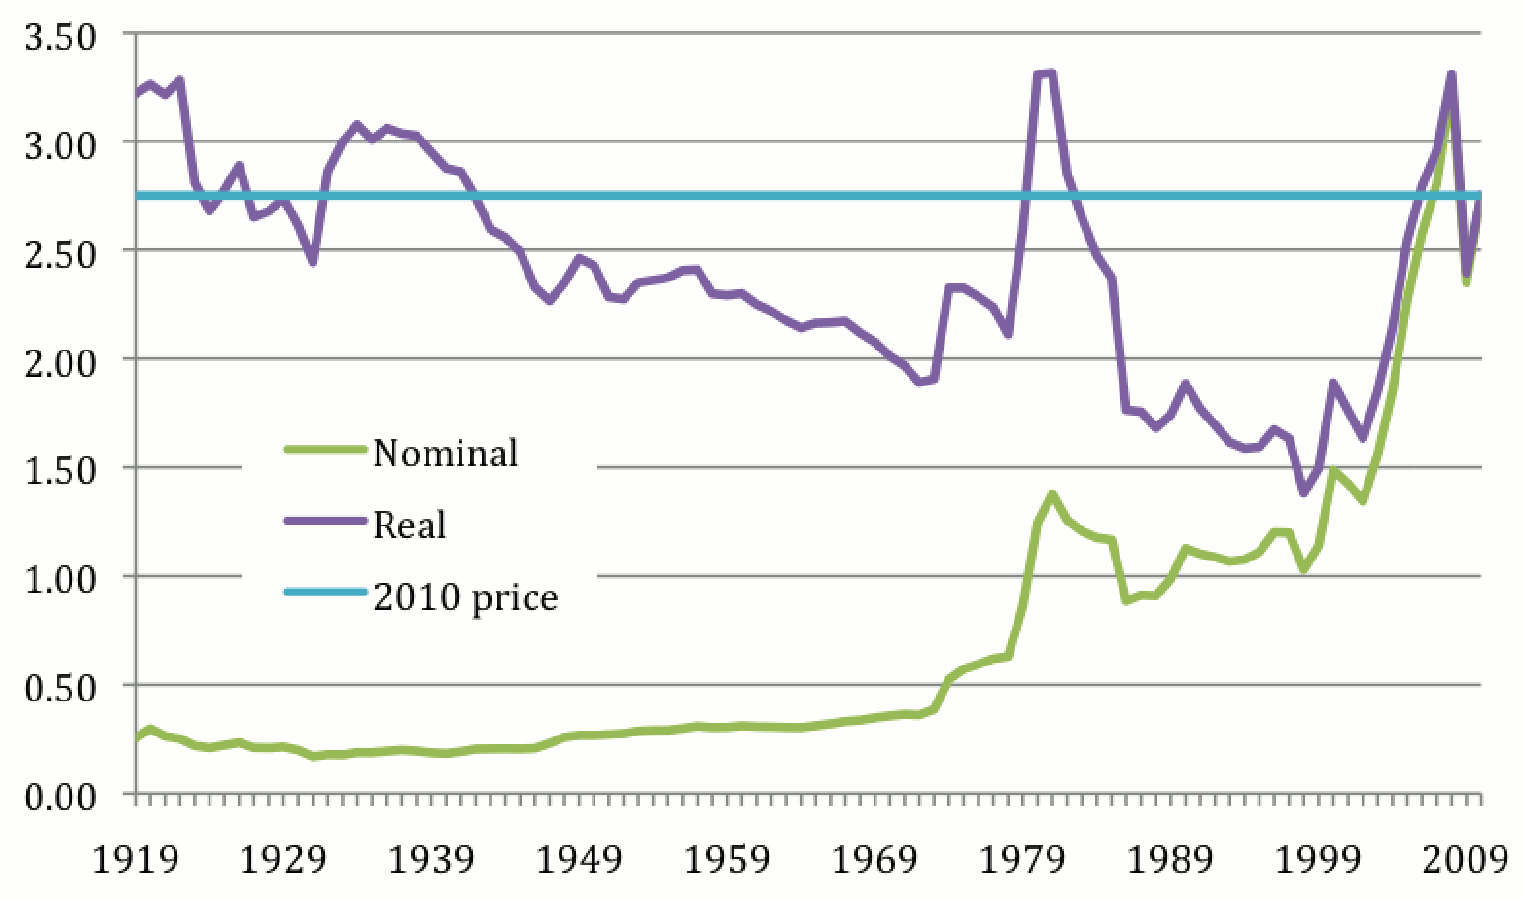

Image Credit: http://4.bp.blogspot.com/-nsh5wKW89io/T4GjBf1fZ_I/AAAAAAAAQQk/mvN9LcC4OS0/s640/world+gas+prices.jpg
Estimates indicate that the United States consumed roughly 8.75 million barrels (275 million gallons) of gasoline per day in 2012. With the national average for a gallon of gas equaling $3.618 in 2012, the highest national average ever, Americans spent just under a trillion dollars per day at the pump in 2012.
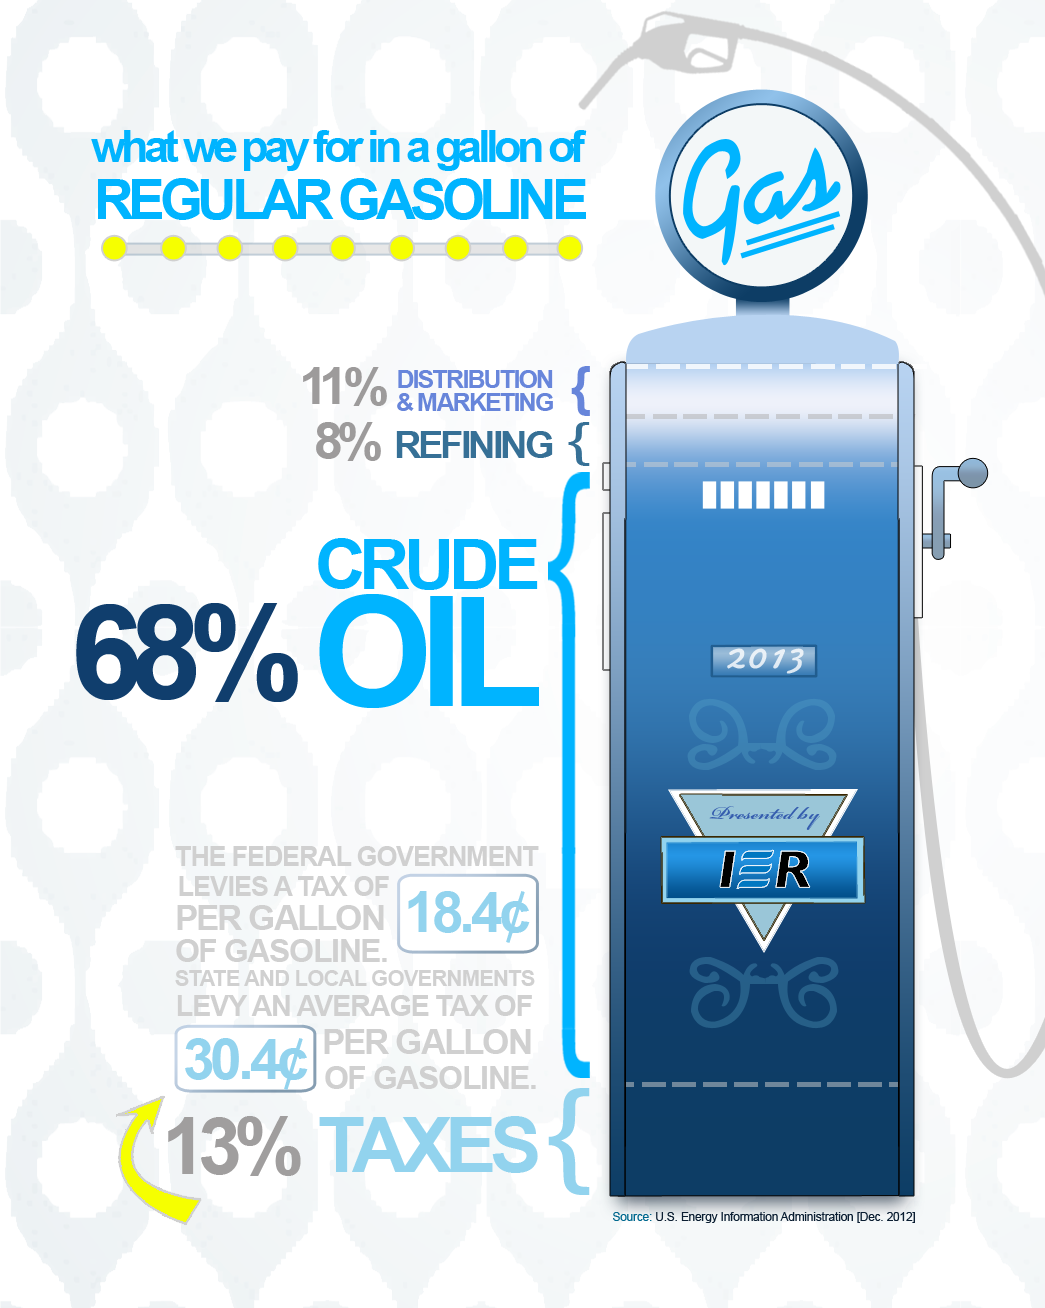 While fluctuating crude oil prices result in the largest variance in the price at the pump, several other factors are key contributors. In the United States, as well as in most other countries, the cost of a gallon of gas is a function of the price of crude oil, refining, distribution and marketing, and taxes. For example, in the United States taxes comprise about 13% of the price of a gallon of gas. Federal taxes on a gallon of gas are 18.4¢ and state and local taxes are typically about 30.4¢ per gallon.
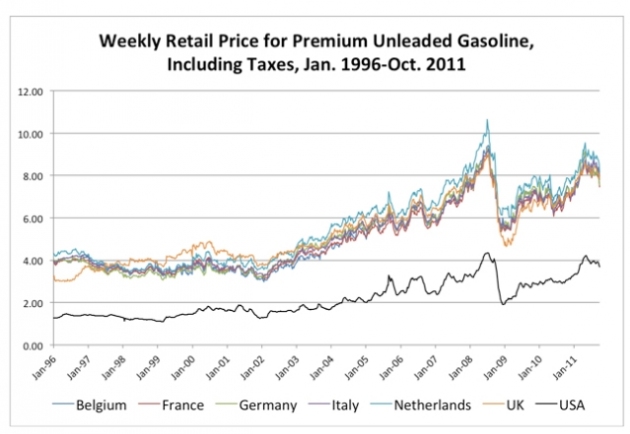
The factors contributing to the price of a gallon of gasoline vary substantially around the globe. Gasoline in European nations is historically three to four times more expensive than in the U.S due in large part to considerably higher fuel taxes. Further, many countries (Indonesia, Iran, Malaysia, Mexico, Nigeria, Turkey, United States) subsidize gasoline in an effort to keep pump prices down. The German Agency for International Cooperation (GIZ) produces a comprehensive annual report on global gasoline prices. The 2010/2011 report can be found here. The following chart shows the countries with most and least expensive gasoline prices.
| Most Expensive Gasoline (May 2013) | Least Expensive Gasoline (May 2013) | |||||
| Rank | Country | US$/US gallon | Rank | Country | US$/US gallon | |
| 1 | Norway | $9.54 | 1 | Venezuela | $0.06 | |
| 2 | Turkey | $9.45 | 2 | Iran | $0.40 | |
| 3 | Netherlands | $8.72 | 3 | Saudi Arabia | $0.73 | |
| 4 | Italy | $8.38 | 4 | Qatar | $0.88 | |
| 5 | Greece | $8.08 | 5 | Bahrain | $0.97 | |
| 6 | France | $8.08 | 6 | Kuwait | $1.07 | |
| 7 | Sweden | $8.04 | 7 | Oman | $1.41 | |
| 8 | Israel | $8.04 | 8 | Yemen | $1.61 | |
| 9 | Cape Verde | $7.99 | 9 | Brunei | $1.80 | |
| 10 | Belgium | $7.99 | 10 | Bolivia | $1.95 | |
For more on the global gasoline market, see the GIZ report or any of the other links in the post.

Reblogged this on Energy post.