
Part 1 of this series provided a brief retrospective of some of the antecedents of today’s discussion of residential rates in California. We discussed AB 1x and its role in capping rates for consumption below 130% of baseline, we defined baseline, and saw an example of baseline allowances from San Diego Gas & Electric (SDG&E). In the previous entry, we left off right when the California Public Utilities Commission adopted a 5-tier, inclining block structure for residential electricity rates [D.01-09-059, D.01-05-064]. In Part 2, we will discuss in more detail the concept of inclining block rates, the policy rationale behind them, and how residential electricity rates look today in California as a result of this policy.
Inclining Block Rates
Inclining or increasing block rates structures charge a higher rate for each incremental block of consumption. The figure below shows an illustrative example of such a rate structure. The first block of 100 kilowatt-hours (kWh) would cost $0.10 per kWh, the second block of 100 kWh would cost $0.12 per kWh, and so on. In this illustrative example, the customer would pay a total of $52 for 400 kWh – the sum of each 100 kWh block of consumption times the respective rate). The average cost would be $0.13 per kWh ($52.400 kWh).
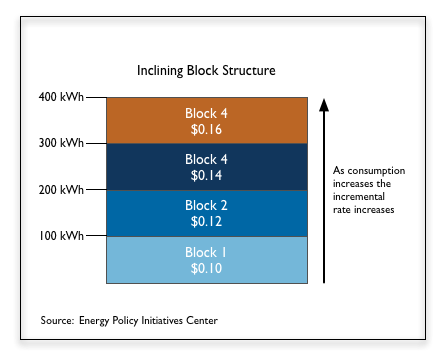
There are at least two policy rationales for inclining block rates: (1) to encourage conservation, efficiency, and self-generation by sending a price signal to high users and (2) to mitigate the effect of rate increases on lower consuming – presumably lower-income – customers and to ensure that essential uses of electricity remained affordable for all customers. (Borenstein 2008, National Action Plan for Energy Efficiency 2009, Faruqui 2008).
Residential Rates Today
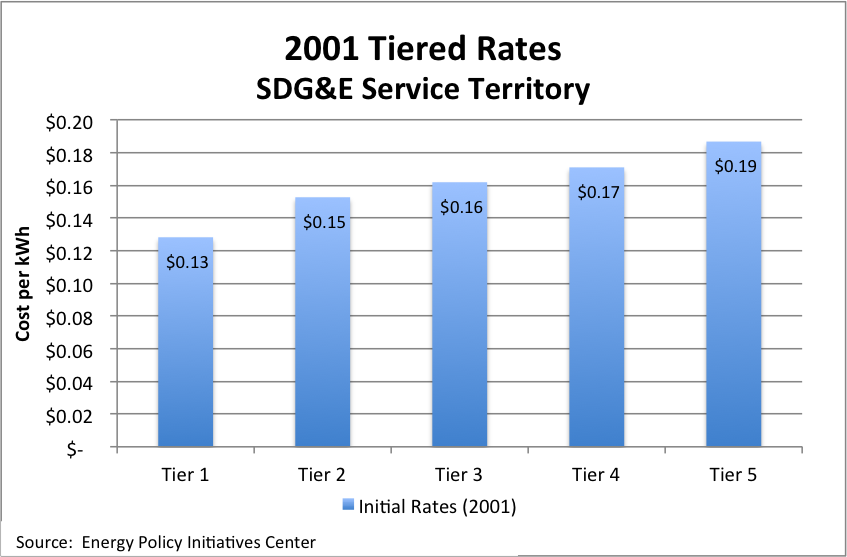
As mentioned in Part 1, after the passage of AB 1x the CPUC adopted a 5-tier, inclining block structure, with rates for Tiers 1 and 2 capped at 2001 levels and three tiers for consumption above 130% of baseline that were uncapped. The practical consequence of this structure was that all increased costs were allocated to the three tiers above 130% of baseline. In 2001 when the first version of the 5-tier rate structure was adopted, the differential price for each tier was not significant.
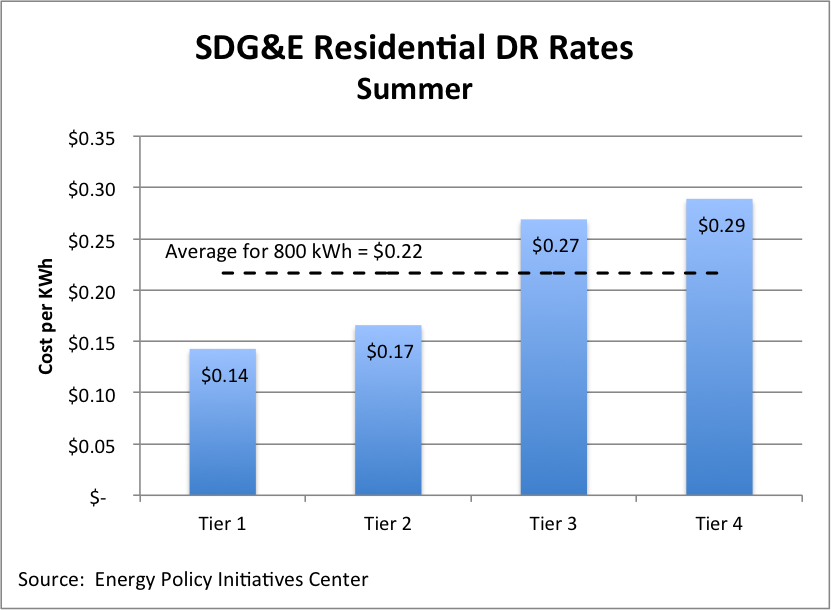
Over time, as costs increased, the upper three tiers increased while the baseline and 130% of baseline tiers stayed constant. In time, the difference in tier 2 and tier 3 rates increased significantly. The 5 tiers were collapsed into four tiers. An example of current 4-Tier residential rates is included in the figure below. This example shows SDG&E residential DR rates for an inland customer during the summer months of May 1 to October 31. It also shows the cost per Tier, the total monthly cost, and the weighted average across all kilowatt-hours.

The Tiers of High Consuming Customers
The Figure below shows the rates for each tier. Tier 2 is 16% higher than tier 1, which is similar to what the differential was previously when there were only two tiers. Tier 3 is 88% higher than baseline and tier 4 is more than double the baseline rate. The Tiers are really clustered into Low Tiers (tiers 1 and 2) under the AB 1x cap and the High Tiers (tiers 3 and 4) above that cap. The lower two tiers are relatively close in size compared to each other, as are the upper two tiers; however, there is a growing gap between the upper and lower tiers. The average rate for the lower two tiers is $0.15 per kilowatt-hour. The average for the upper two tiers is nearly double ($0.28/kWh based on 800 kWh per month). Tier 3 is 62% higher than tier 2. This differential represents the increased costs that have been allocated to the upper tiers. Lawmakers recognized that upper-tier rates were increasing significantly and they adopted SB 695 to permit the CPUC to allow investor-owned utilities to allocated a portion of increased costs into Tiers 1 and 2.
The figure below shows a comparison of current residential electricity rates for summer for the three major investor-owned utilities in California.

Legislation to the Rescue?
The growing gap between the lower tiers and upper tiers raised the attention of California legislators. In the third and final part of this series we will discuss some of the arguments for and against the current rate structure and two pieces of legislation to address residential rates, SB 695 (enacted in 2011) and AB 327, which is currently being considered.

Pingback: Residential Rates Revisited – Part 3: Legislative Fixes | The EPIC Energy Blog