
I have written about the importance of electric emissions factors to estimating greenhouse gas emissions in inventories and the impacts of policies to reduce emissions (see here, here, and here). This post discusses the issue of attributing emissions from electricity production to the customers who use it.
We began to think more about this issue during a project to develop a greenhouse gas inventory for an organization that receives its electricity from a direct access provider. We needed the annual average emissions rate (lbs of CO2 equivalent per MWh) of the electricity supply for the year in question. The direct access provider gave us an average emissions rate of 563 lbs CO2e/MWh. This value seemed low to us. It turns out that this value is the emissions rate for electricity included in the US Environmental Protection Agency’s eGrid database for plants located in the California Independent System Operator (CAISO) control area. The justification for using this value was the fact that all electricity is dispatched by the CAISO and there is effectively a large pool of electricity from which electricity is drawn, so the applicable emissions rate for electricity supplied by this provider should be the same.
By analogy, this would be like asking 10 people to put random drops of red, blue, and yellow dye into a pool of clear water and saying that each person contributed the same number and combination of drops. In the end the color of the pool will be the “average” of all the drops entering the pool. But it does not follow that each person entered the same number of drops from the same colors – they each entered a different amount and ratio of colors. Using the average greenhouse gas emissions intensity for an entire pool of electricity – like the CAISO – does not tell us the emissions rate of a particular load serving entity (e.g., utility or direct access provider). For this, it is necessary to determine the contribution of a particular load serving entity to the overall average.
This raised an important question for us: What is the best approach to attribute emissions from electricity production to those who consume it in a utility service territory, city, or specific company?
The GHG Emissions Causation Principle
The electricity sector is an important factor when estimating greenhouse gas emissions. In general, to estimate emissions from electricity consumption it is necessary to determine the emissions rate per unit of electricity. CAISO or WECC average emission rates are sometimes used as proxies for more detailed emission rate calculations. As noted above, one argument for this approach is that all the power is essentially mixed, the electricity is dispatched from a large pool, and it is impossible to tell which electrons were actually consumed. This may be true operationally, but based on plant ownership, contracts, system dispatch, and end-user demand it should be possible to track most electricity from production to consumption.
In electricity rate making there is a well-accepted principle called cost causation. That is, the price of electricity should be determined, to the extent possible, by cost to generate and deliver that electricity to a particular customer class. In short, the customer who causes the cost pays the cost. It seems that this same principle should apply to allocating emissions in the electricity sector; that is, the consumer who causes the emissions through electricity consumption should be assigned the emissions. This general principle is being used in much of greenhouse gas analysis, particularly for inventories. We already assume that the emissions from purchased electricity accrue to the purchaser. But these estimates can be based on an electric emission factor that is not be consistent with the causation principle.
Based on this principle, it is not enough to know the average of the entire pool. It is necessary to determine the contribution of every source to the average; that is, what are the emissions caused by consumption in a particular area or organization? It would seem that the smallest scope of analysis would yield the most accurate result. Emission rates differ depending on the geographical scope of analysis. For example, the average rate for the Western Electricity Coordinating Council (WECC) would differ from WECC sub-areas, which would in turn differ from average emissions rates from independent system operators, utility service territories, or cities.
We don’t need to know exactly where electrons are going on the grid to attribute causation – it is not a power systems engineering challenge, it is an accounting challenge. Using SDG&E as an example, we know the origin of 80% of the electricity consumed (emissions caused) in SDG&E’s service territory. This is largely based on purchases. But we do have a problem with the other unspecified power. How do we account for the 20% of unspecified power purchased on the market or through the CAISO? Could we have a fuel source or origin tag on blocks of electricity that are bought and sold through the market?
Why does Causation Matter?
The CAISO is considering expanding to include other Western states. What are the greenhouse gas implications of incorporating neighboring states into the CAISO whose electric emissions rates are 2-3 times higher than the CAISO’s rate? The figure below shows a comparison of the 2012 emission rates from US EPA’s eGrid for the power plants located in the CAISO control area and three neighboring WECC sub regions (Northwest, Arizona-New Mexico, and Rocky Mountain).
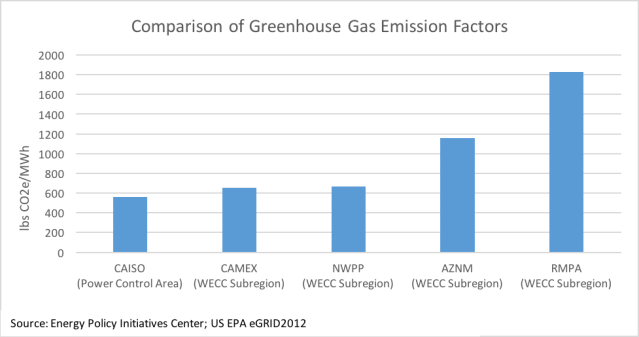
When electricity from a larger, dirtier pool of supply is mixed with the CAISO’s cleaner electricity, the CAISO average emissions rate will go up and that of the newly added regions will go down. The ability to tease out the origins of electrons could become more important. Using the logic of the causation principle, we would want to trace the newly combined pool of electricity back to the source, so we could show the emissions caused by the consumption of a particular entity rather than a now dirtier average. This may also increase the importance of figuring out the sources of unspecified power.
Another area that is affected by this issue is local climate action planning. Numerous cities in California and across the U.S. have adopted plans, which sometimes rely on average electric emissions factors from large geographical areas like the CAISO or WECC. This practice obscures the emissions impacts of decisions and actions by a particular utility, local government, or organization. For example, PG&E generally has a lower average emission factor than other providers. So, estimates of emissions or reductions in that service territory using a CAISO or WECC average would obscure PG&E’s lower emissions rate. On the other hand, a supplier with an emissions rate higher than California’s average would prefer to use that average and claim a lower rate, which would seem to overstate the impacts of their actual purchases. Developing a consistent method for allocating emissions based on causation could provide more accurate and comparable results.
The emissions causation idea is already applied to other sources of greenhouse gas emissions. For example, landfills emit methane, a potent greenhouse gas. It is possible to allocate a portion of landfill emission to cities based on the percentage of waste generated, the ultimate cause of the emissions.
As greenhouse gases, mainly carbon, become a currency by which progress is measured, it will become more important to understand the origin of every electron and to develop methods to allocate the emissions from those electrons to the ultimate consumers. Causation is pretty good principle to start with when developing such a method.

Pingback: AB 1110: GHG Emission Intensity Reporting for Electricity, Causation, and the Problem of Electricity from Unspecified Power | The EPIC Energy Blog
Pingback: GHG Emissions Reporting in the California Independent System Operator (CAISO) Energy Imbalance Market (EIM) | The EPIC Energy Blog
Pingback: AB 79: Quantifying Hourly GHG Emissions from Unspecified Electric Generation Sources | The EPIC Energy Blog