

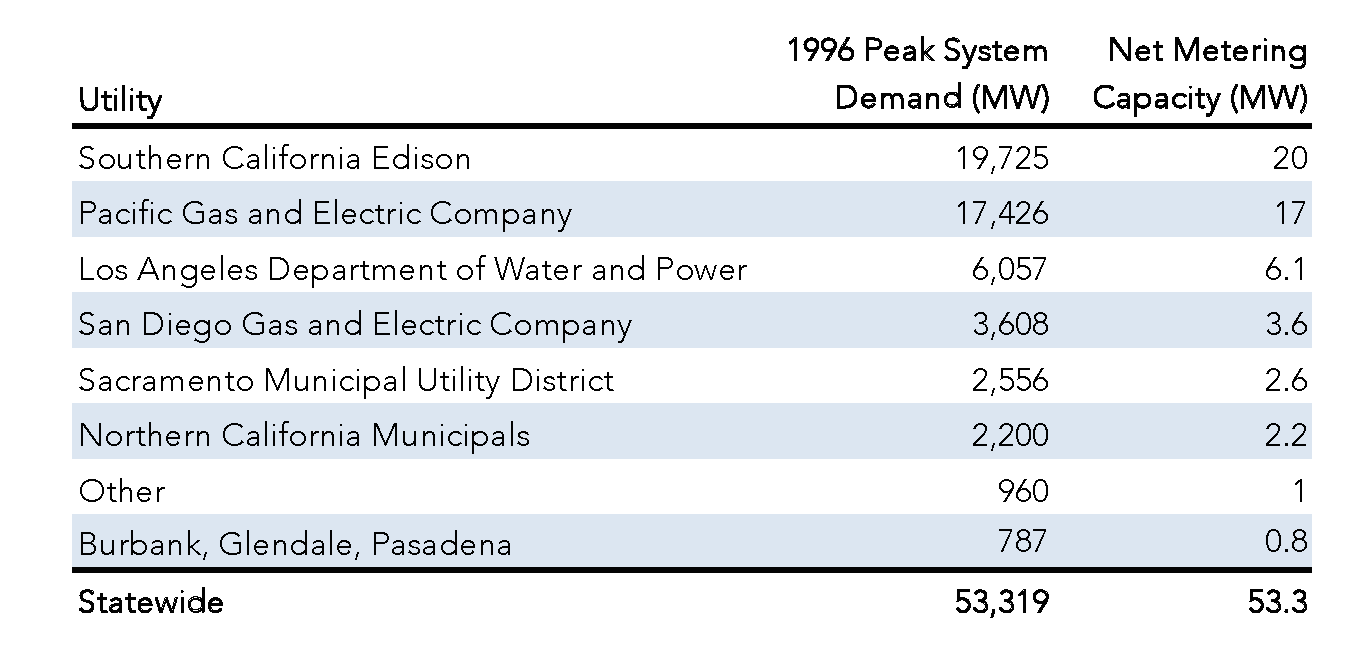
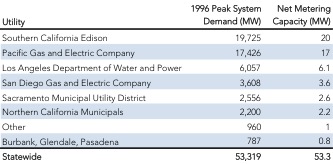
San Diego has a history of being a leader in rooftop solar. In a March 2015 report by Environment California, San Diego ranked 2nd in total capacity installed and 4th in capacity per person. Previous versions of this same report had similar results. San Diego also has regularly been the first bumped up against statutory capacity limits to net energy metering. SB 656 (Alquist) was signed into law in 1996 and provided for net energy metering (NEM) to be offered to customers in California “…until the time that the total rated generating capacity owned and operated by eligible customer-generators in each utility’s service area equals 0.1 percent of the utility’s peak electricity demand forecast for 1996…” At the time, these limits added up to 53 megawatts (MW) statewide, including 17 for PG&E, 20 MW for SCE, and 3.6 MW for SDG&E.
Figure 1: SB 656 Net Energy Metering Capacity Caps by Utility
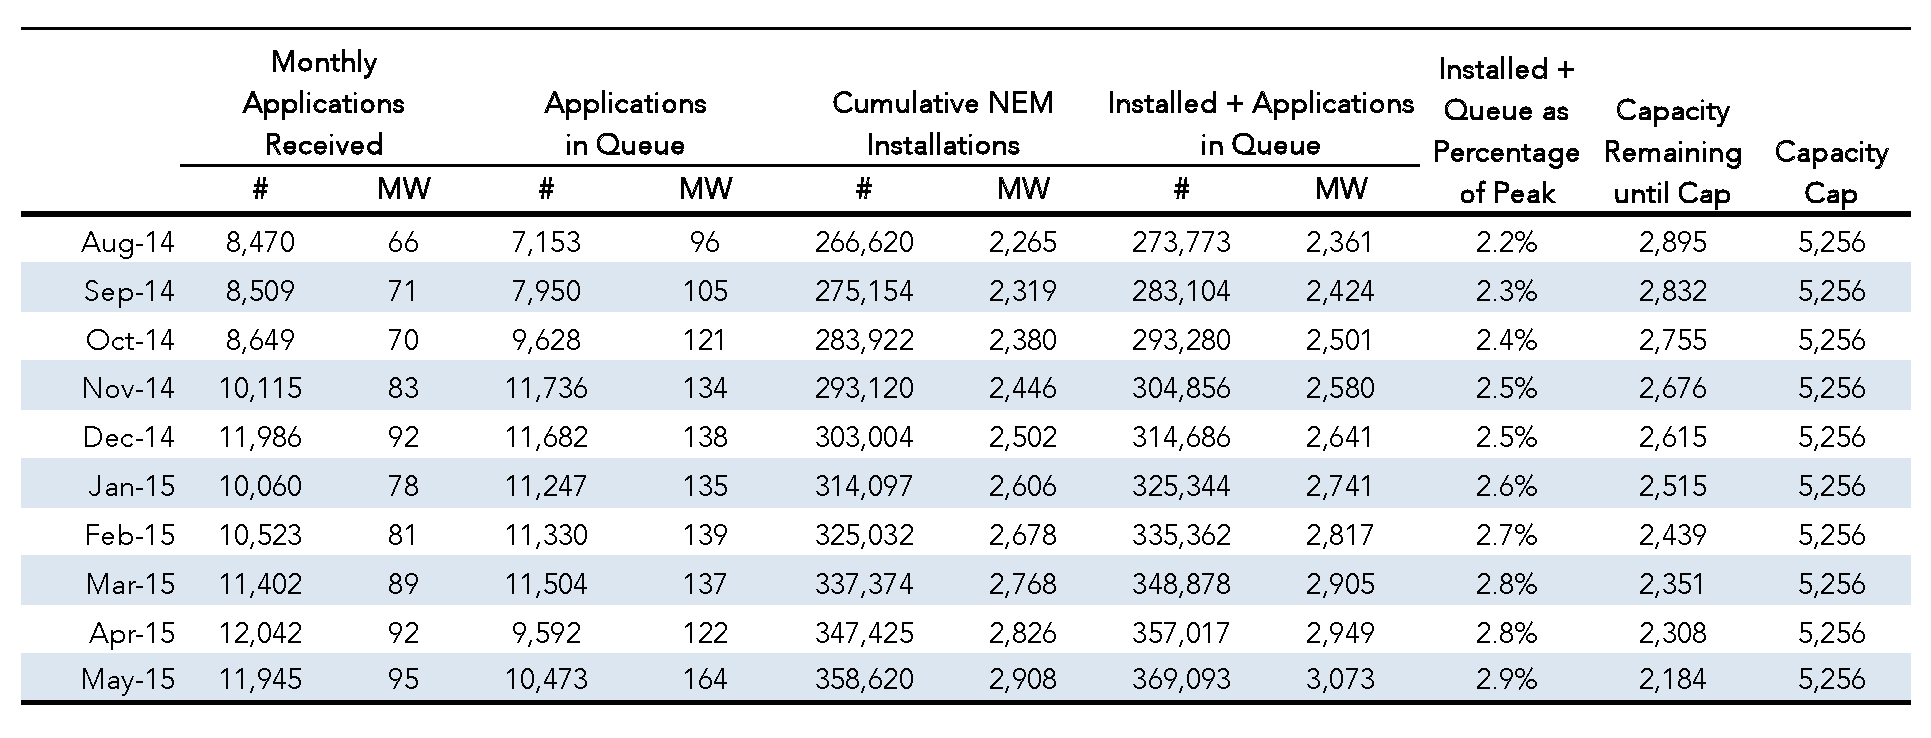
Today, these sums seem laughable, but in 1996 when there was virtually no grid-connected solar, these may have seemed high. Today statewide grid-connected solar capacity for the three investor-owned utilities is nearing 3,000 MW. This is about half of the levels of utility-scale solar in California. In March of this year, the Energy Information Administration reported that California was the first state to generate more than 5% of its energy from utility-scale solar, with about 5,400 MW installed at the end of 2014. On June 11th of this year, the California ISO reported that it hit a new solar record of about 6,100 MW. Nonetheless, 3,000 MW of distributed solar a far cry from the original net energy metering cap of 53 MW in 1996. These days, California adds more net energy metering capacity in one month than the original 53 MW cap. In May 2015, incremental solar installations totaled about 80 MW with 164 MW in the queue.
Figure 2 Statewide Net Energy Metering Totals (Source: Advice Letters 3229-E, 4649-E, 2751-E)
A Rising NEM Cap Lifts All Panels
With SB 656 (Alquist) in place, the NEM caps were 0.1% of peak demand. The San Diego region was the first in the state to near that cap. In September 2002, then Governor Gray Davis signed into law AB 58 (Keeley) to increase the NEM cap from 0.1% to 0.5%. San Diego again led California’s investor owned utilities (IOU) toward the new cap. This led to adoption of SB 816 (Kehoe) in 2005, a stopgap measure that increased the NEM limit to 50 MW for the SDG&E service territory. A year later, then Governor Arnold Schwarzenegger approved SB 1 (Leno), which among other things increased the cap from 0.5% to 2.5%. It did not take long for the solar installations to approach the new cap and in February 2010, the Governor signed into law AB 510 (Skinner) to increase the cap to 5%.
The current NEM cap remains at 5% but the definition of what that percentage applies to has changed. In 2012, the California Public Utilities Commission (CPUC) adopted Decision 12-05-036, which ruled that “aggregate customer peak demand” means the sum of the peak demand of each customer regardless of whether it occurs during the system peak. This effectively doubled the capacity cap for NEM. That brings us to the end of our legislative journey: AB 327 (Perea). Adopted in 2013, this bill codified the NEM capacity caps approved by the CPUC. These are 607 MW for SDG&E, 2,240 MW for SCE, and 2,409 for PG&E. AB 327 also set in motion a transition to a new NEM regime. It requires the CPUC to develop a standard tariff or contract no later than December 31, 2015. This NEM-replacement is to take effect on July 1, 2017 or when the current capacity caps are met.
Once again, SDG&E service territory is leading the pack and likely will hit the cap before the July 1, 2017 deadline. But when will SDG&E hit the cap?
A Look at the Numbers
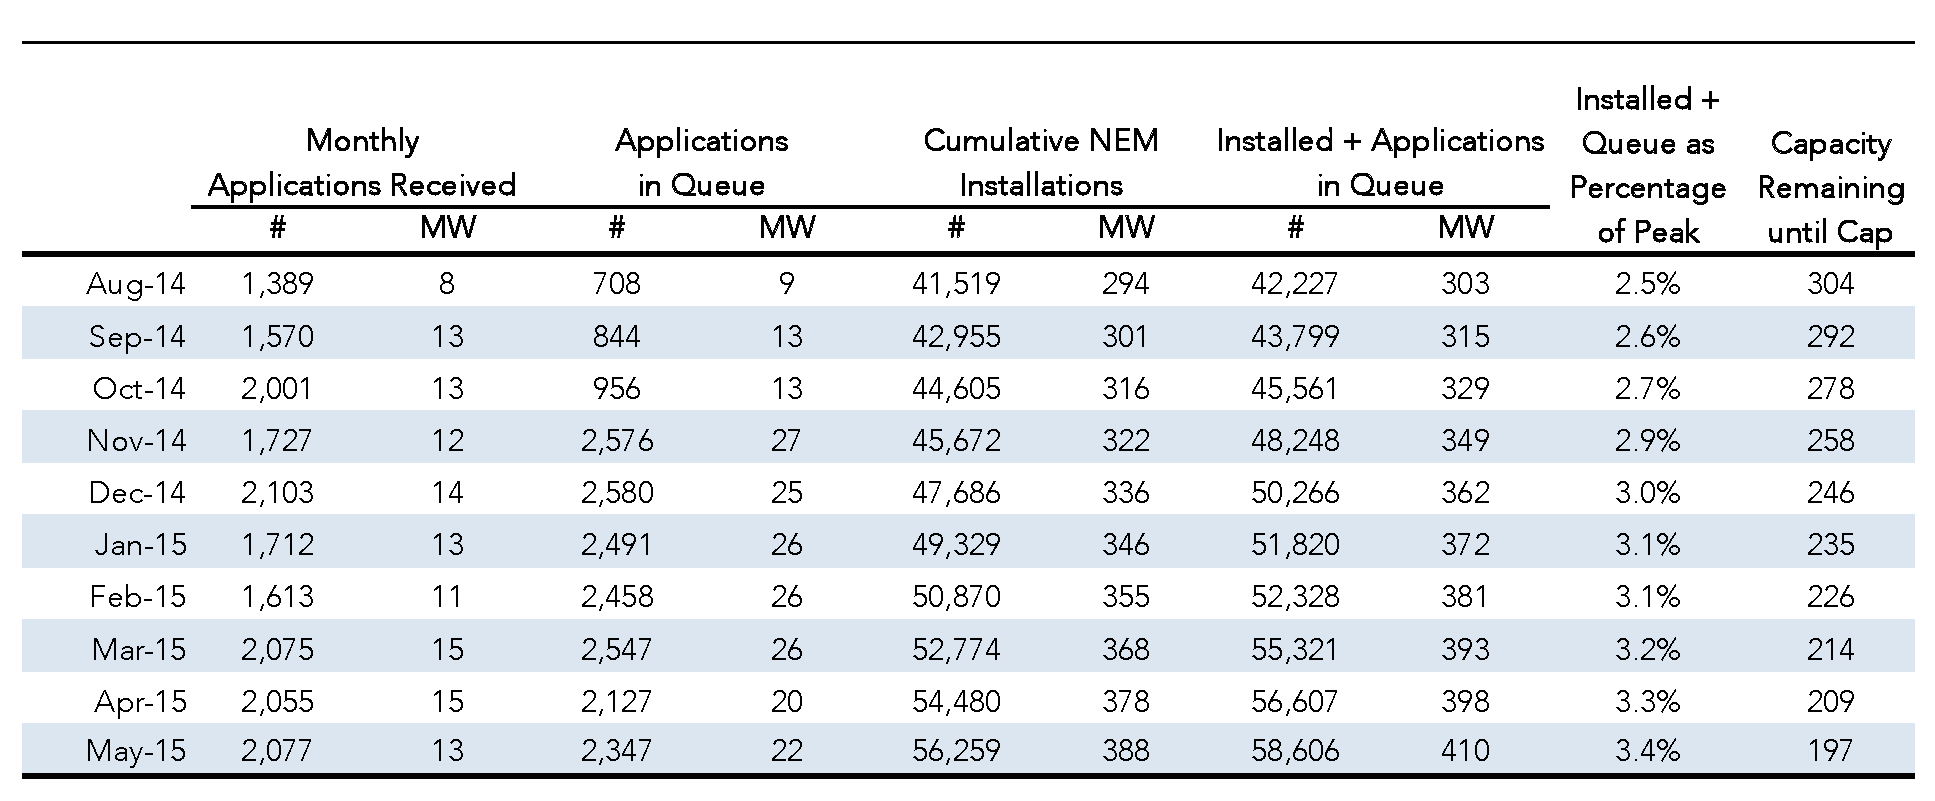
Currently there are 56,259 net energy metered systems installed in the SDG&E service territory representing 388 MW. There are also 2,347 systems representing 22 MW in the queue for interconnection. If we count those too, this leaves about 197 MW to reach the cap of 607 MW. Each month the total capacity of systems installations and applications in the queue totals about 12 MW. If this pace continues, we would hit the cap in October 2016.
Figure 3 SDG&E Service Territory Net Energy Metering Totals (Source: Advice Letter 2751-E)
How accurate is this projection? Well, at EPIC we have found that our crystal ball is as cloudy as most, but it might be best to characterize this estimate as a business-as-usual projection. If the rate of installations accelerates in the next couple quarters due to the sense of scarcity – real or perceived – heard on San Diego’s airwaves, SDG&E service territory could hit the cap sooner. It is safe to assume that as we approach the capacity cap, there will be an acceleration of solar sales. The magnitude of this effect and when it begins are not clear. Based on the trends in the current data, there does not appear to be any significant uptick in installations. If, on the other hand, the rate of installations slows due to pending residential rate changes that would collapse four tiers eventually into two, reduce the upper tiers from the $0.40/kilowatt-hour (kWh) range to the $0.20/kWh range, and introduce a minimum bill, then it could take longer to hit the cap. It is also safe to assume that pending rate changes will have some effect in the marketplace but how much and when is also not clear.
By the way, using this same business-as-usual projection method, PG&E would hit its statutory capacity cap closer to the July 1, 2017 cut off date, and SCE would not hit its capacity cap until Spring 2018. So it is safe to say that barring some significant change in market performance, SDG&E’s service territory once again will hit the statutory capacity cap first.

I have yet to see data on what % of energy (kwh) is produced by customer-owned solar. All of the targets etc. are based on power (kw) even though the descriptive “energy” is (incorrectly) used.
There has been a lot of analysis to estimate and measure the actual energy production of solar photovoltaics not to mention many systems can measure actual output. Here is a quick look at some numbers…If we take the 388 MW installed in SDG&E service territory (ignoring those systems in the queue but not yet installed), the capacity (MW) represents about 8% of system peak demand (MW) but only 3% of energy (MWh) using CA Energy Commission forecast values for 2015. This difference is mainly due to the fact that solar has a capacity factor of about 20%. Note the blog references that fact that the current NEM caps are based on “aggregate customer peak demand” and not system peak demand, as these quick calculations reference.