

Co-authored with Bill Brick (San Diego Air Pollution Control District)
Over the past several weeks there has been a reduction in daily vehicle miles traveled (VMT) in the San Diego region due to Shelter-in-Place orders issued by the Governor of California. As discussed in a previous blog post, this decline in VMT has led to a reduction in greenhouse gases, the key gases in the changing climate. But there is also a relationship between VMT and daily and short-term air pollution.[1] We know that over two-thirds of smog-forming emissions in San Diego county are generated from mobile sources.[2] Air pollutants emitted from cars, diesel-powered trucks, buses, and other heavy‑duty equipment include oxides of nitrogen (NOx) as well as diesel particulate matter (PM).[3] It is reasonable, therefore, to expect that the reduction in VMT also would result in a reduction in such mobile source air pollutants.
The media has reported on how lock-downs have affected air pollution in many parts of the world and how clean and clear the air has become in metropolitan areas. People in the San Diego region have been asking the same question of how this reduction in VMT has affected our air quality. Due to this heightened interest in recent air monitoring data, the San Diego Air Pollution Control District (District) has provided a preliminary assessment of air quality measurements (even before the March 2020 data have been fully processed and validated). This post summarizes these preliminary findings.
As part of its responsibilities under federal regulations, the District maintains a network of ambient air quality monitoring stations (Figure 1).[4]
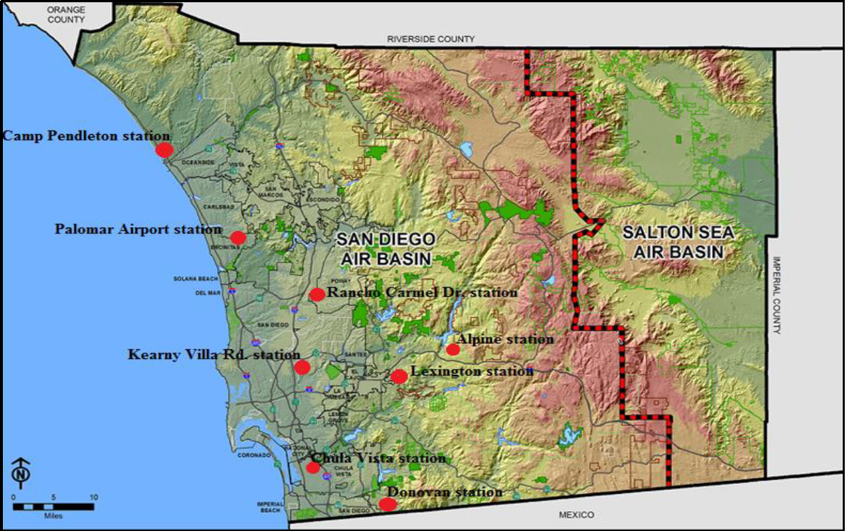
The stations monitor for ozone, NOx (NO and NO2) and particulate matter of 2.5 micrometers and less in diameter (PM2.5). These pollutants have health-based ambient air standards and nitrogen dioxide (NO2) is an important chemical related to the formation of ground-level ambient ozone (formed by a photochemical reaction between NO2 and volatile organic compounds – that is, ground level ambient ozone needs sunlight and heat to be produced in harmful[5] quantities).
Ground-level ozone can build up to unhealthy amounts if combined with atmospheric inversion layers, which trap air pollutants near the ground. During the month of March 2020, the San Diego region experienced numerous episodes of cloudy and rainy weather. This stormy weather influenced air quality levels measured during this month. Therefore, inferences or conclusions based on ozone concentrations are not straightforward[6] and not addressed here. Similarly, conclusions drawn on PM2.5 data is complex and will not be addressed here.
The chart below (Figure 2) focuses on the daily hour-averaged concentrations of nitrogen dioxide (NO2) measured at all the stations (Figure) during the month of March 2020 through April 12, 2020. Although there are day‑to‑day fluctuations based upon atmospheric stability related to the weather, we see a decrease at all of the stations after the first week of March through April 12th. This change corresponds to the trend shown by the VMT decrease, leading to the observation that the drop in VMT is related, although it is not the only factor, in the observed drop in NO2.
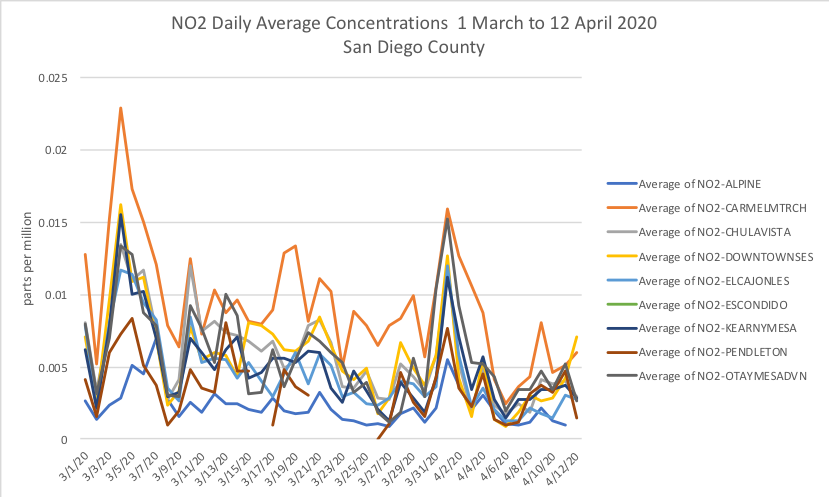
Figure 2: Daily Average NO2 Concentrations (ppm) from San Diego Region Air Pollution Monitoring Network
Another observation can be made by comparing the NO2 data from March 2020 to March 2019. The Chula Vista (CVA) monitoring station data is selected as indicative of freeway traffic as it is located immediately east of the I-5 freeway. Chula Vista station data for NO2 is shown in Figure 3.

Figure 3: Chula Vista Air Pollution Monitoring Station Nitrogen Dioxide Levels, Same Time Period, March, in 2019 and 2020.
This chart shows that NO2 levels during the peak morning and evening commute times were 20% and 26% lower (0.004 ppm) in March 2020 than in March 2019. Since these differences in NO2 occurred during the peak commute times, the reduced traffic due to the stay at home orders (and therefore vehicular emissions) was a contributing factor.
Therefore, the decreased VMT resulting from the COVID-19 stay-at-home orders has contributed to a decrease in at least one type of criteria pollutant (NO2) from vehicles. We would expect that these emissions will increase once the order is lifted and people return to their normal schedules. How quickly this occurs depends on when and how restrictions are lifted, the severity and duration of the economic downturn, and the extent to which we revert back our previous commuting patterns. How much of a difference this decrease has made to public health is another issue that likely will be studied by health professionals in the future.
[1] The six most common air pollutants, often called “criteria air pollutants”, include particulate matter, ozone, carbon monoxide, sulfur oxides, nitrogen oxides, and lead. For more on these criteria air pollutants, see the US Environmental Protection Agency website at https://www.epa.gov/criteria-air-pollutants.
[2] California Air Resources Board 2016 Estimated Annual Average Emissions, San Diego APCD, https://www.arb.ca.gov/app/emsinv/2017/emssumcat_query.php?F_YR=2012&F_SEASON=A&SP=SIP105ADJ&F_DIV=-4&F_AREA=DIS&F_DIS=SD, downloaded April 23, 2020.
[3] The EPA states that the transportation sector is responsible for over 55% of NOx emissions in the US but less than 10% of particulate matter (https://www.epa.gov/transportation-air-pollution-and-climate-change/smog-soot-and-local-air-pollution). The contribution of diesel towards air pollutants in the San Diego region (and California) is significantly less than in other parts of the world due to the relatively low percentage of diesel vehicles in our overall fleet. In 2018, about 3% of all registered vehicles were diesel-based in San Diego county (DMV data 2018) while the percentages of diesel powered vehicles in European cities are much higher – for example, over 30% of the passenger vehicle fleet in Germany is diesel-powered (European Vehicle Market Statistics 2018/19, at https://theicct.org/sites/default/files/publications/ICCT_Pocketbook_2018_Final_20181205.pdf).
[4] Annual Network Plan 2018, at https://www.sandiegocounty.gov/content/dam/sdc/apcd/monitoring/2018_Network_Plan.pdf. Downloaded April 16, 2020.
[5] Ozone has been shown to cause health problems such as asthma, pneumonia, coughs, and generally affects lung functions at high concentrations. US EPA at: https://www.epa.gov/ground-level-ozone-pollution. However, ozone is not shown in this post because no significant ozone was formed due to weather conditions in March and ozone formation us generally low during the spring season.
[6] APCD urges users of APCD air quality monitoring data to communicate with District staff before publishing inferences or conclusion based on these data. APCD contact is: bill.brick@sdcounty.ca.gov
