
Many thanks to Yichao Gu, technical policy analyst, EPIC.
Vehicle-Miles-Traveled (VMT) is an important metric. VMT determines gas tax revenues, drives the need for and maintenance of roads, and contributes to air pollution (1) and greenhouse gas (GHG) emissions. In San Diego County, on-road transportation emissions are responsible for the largest fraction, more than 40%, of all greenhouse gas emissions and recently people have asked about the effect of the Shelter-in-Place orders on GHGs. GHG emissions are proportional to VMT as long as the percentage of miles driven by zero emission vehicles is low.
In a 2009 report on policy options for local governments to reduce GHGs from on-road transportation in San Diego County, EPIC wrote that a 10% reduction in VMT resulting from a gasoline price increases in 2007-2008 could help achieve the AB32 GHG target for 2020. At the time there were press reports that “VMT had already decreased by 3-4% in one quarter of 2007 when fuel prices increased.” However, the price at the pump did not provide a consistent and predictable VMT reduction (in fact, gasoline prices have plummeted). The report highlighted other policies to reduce VMT. One of those was a “region-wide telecommute policy based on 20% of all commuters telecommuting for 2 days a week by 2020, thus avoiding the average daily commute of 20 miles in a single-occupant vehicle.” We estimated that such a policy could avoid about 320,000 MT CO2e in 2020, equivalent to about 600 million miles avoided. (2)
The EPIC report also stated that “[t]elecommuting (3) has many benefits for employees and employers – greater productivity, reduced costs due to reduced office space needs, reduced relocation costs, reduced commute costs, tax benefits, less commute stress, tax benefits, family benefits, independence and flexibility, reduced absenteeism, a way to attract employees…the avoidance of pandemics and terrorist attacks have been cited as additional benefits.”
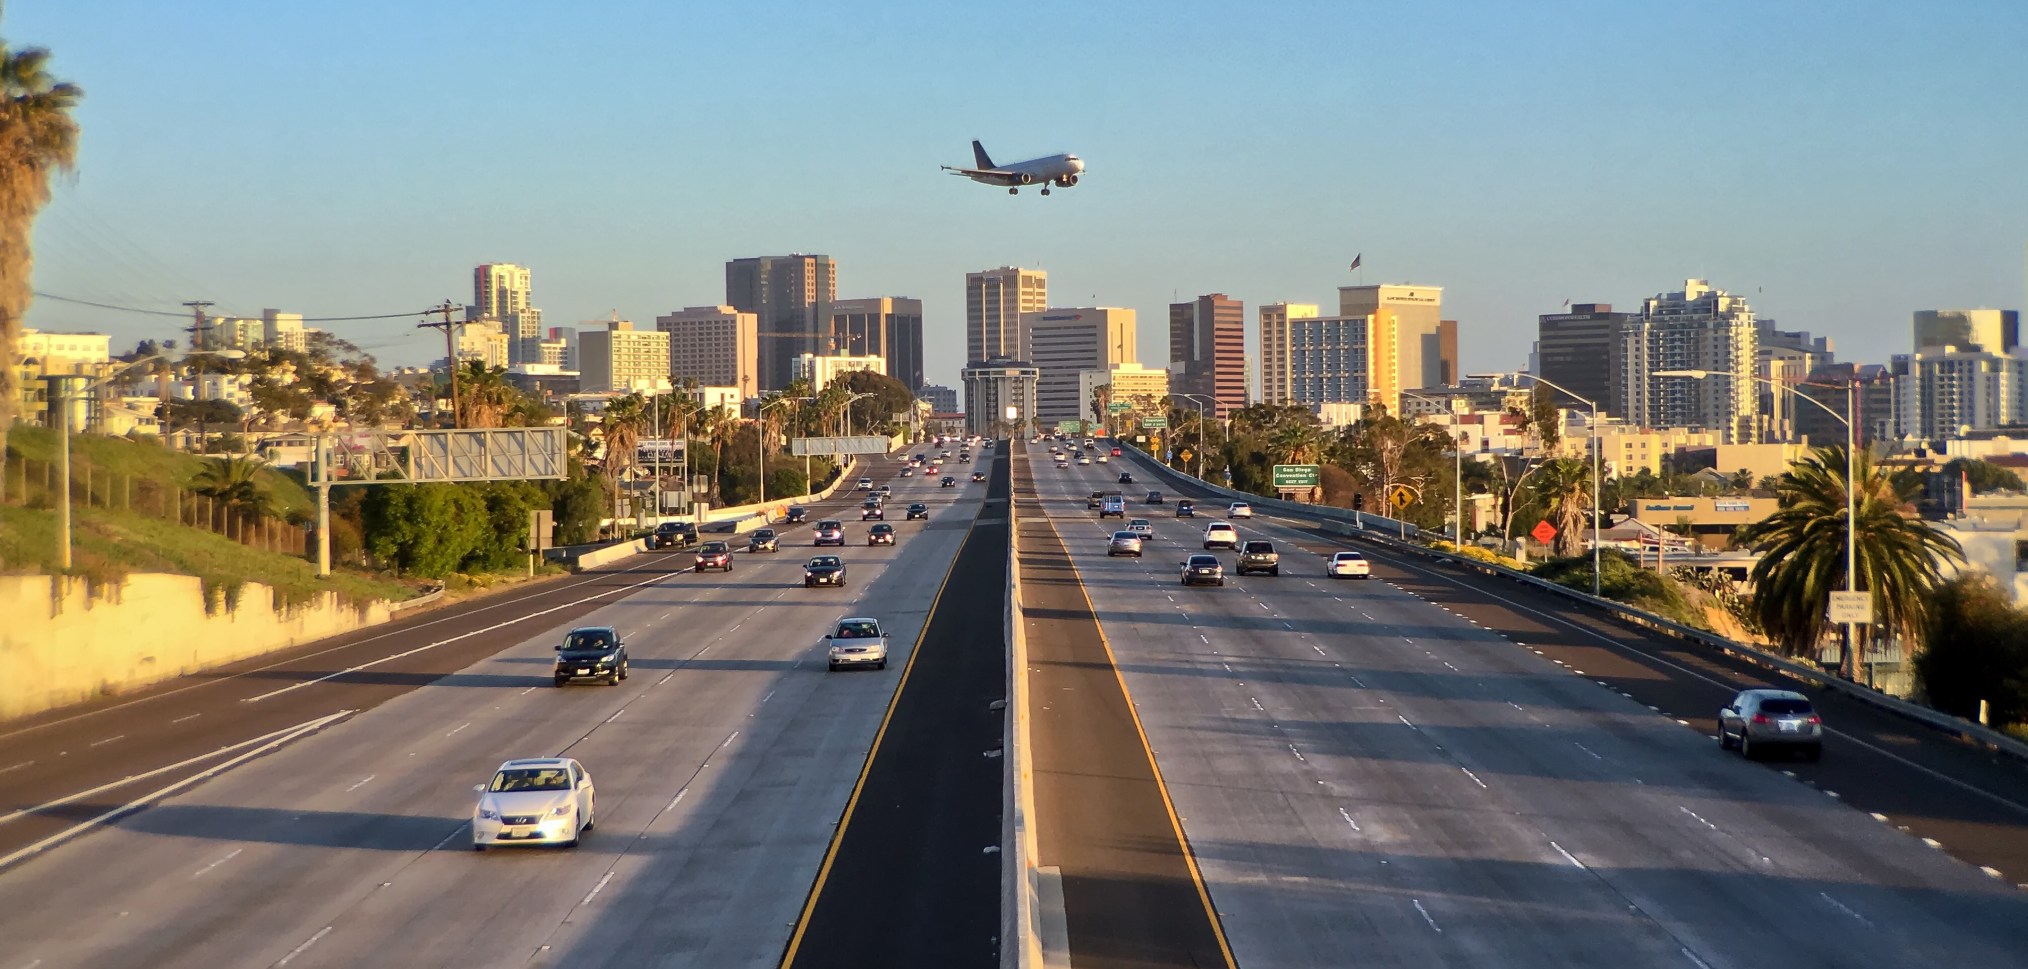
So here we are in 2020, many of us working from home due to a – pandemic. (4) But how San Diegans traveled to work just before the pandemic in 2019 looked pretty much the same as in 2009 when our report was released (Figure 1).
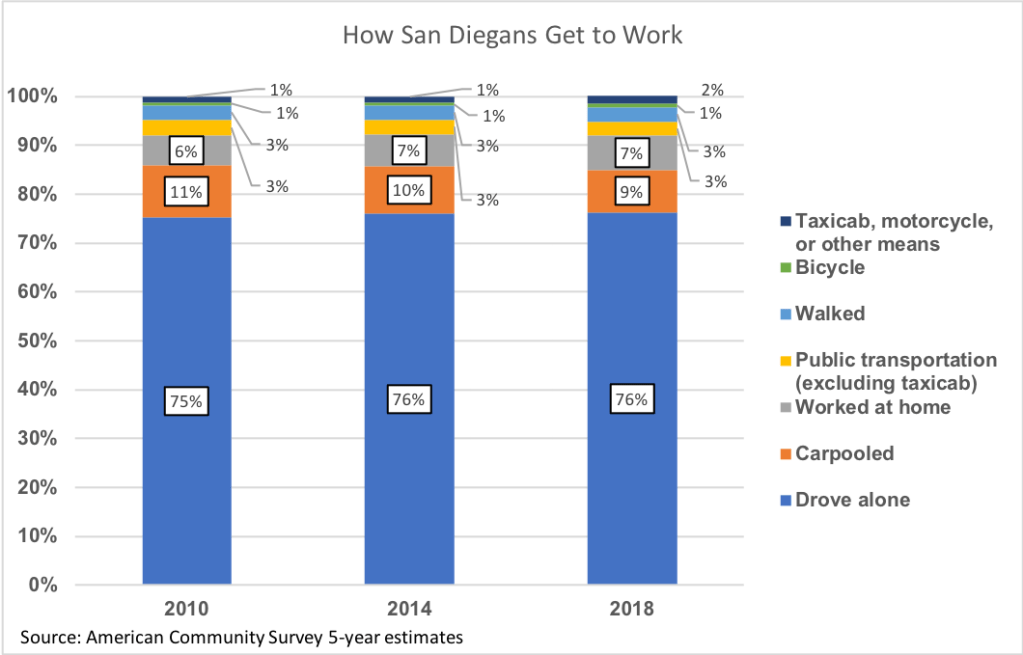
Figure 1: How San Diegans Get to Work
The breakdown of mobility types is remarkably consistent over time. About 75% of us drive alone in our vehicles to get to work, 6-7% work from home, and fewer than 4% used public transportation, walked or used bicycle to get to work. (5) The potential for more people to work from home (6) has been touted since the late 1980s, even up to 16% of the total workforce in the US, but in reality this option has been less popular (7) even if half the companies offered some form of telework option. The U.S. Office of Personnel Management determined that only 6.6% of federal workers actually performed any level of telework in 2006 (8) though this had increased to about 9% in 2010 when the Telework Enhancement Act became law. (9) The Telework Coalition reported that about 6% of the U.S. labor force could be considered as teleworking in 2007. (10)
But COVID-19 has brought work-from-home back into the picture. Now that Shelter-in-Place restrictions have been in place for several weeks, affecting more than just commuters, what has happened to VMT ? And how might it affect greenhouse gas emissions from on-road transportation this year? Data analysts have been busy tracking vehicle movements and here is how VMT (11) has changed since the first of March in San Diego County:
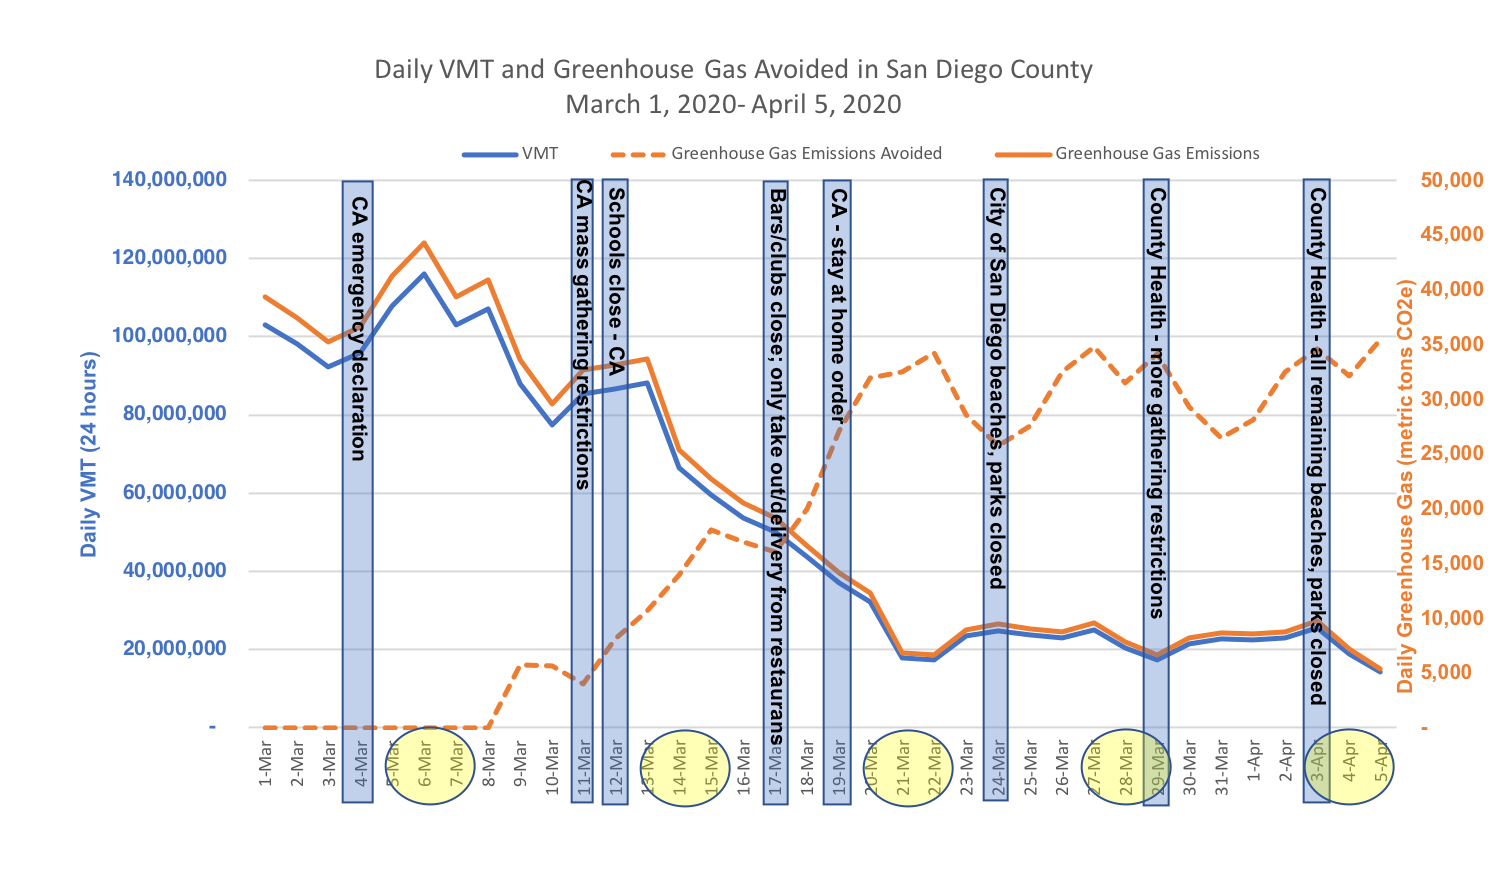
Figure 2: Shelter-in-Place Orders, VMT and GHGs
Energy Policy Initiatives Center, University of San Diego, April 2020
Based on daily VMT data from: https://www.streetlightdata.com/VMT-monitor-by-county/#emergency-map-response,and San Diego region average vehicle greenhouse gas emission rate from California Air Resources Board EMFAC2017 model.
The primary y-axis shows the estimated VMT, and the secondary y-axis shows the associated GHGs emissions or GHGs avoided. Significant shut-down orders are indicated with blue bars and Fridays and weekends are identified with a yellow circle in Figure 2. We focus on trends. The first week of March was a fairly normal business-as-usual week when we saw VMT rising as usual during the weekend (blue line in Figure 2). The State emergency declaration on March 4 did not directly impact individuals. But when mass gathering restrictions and school closures were ordered, we saw a large drop in VMT, which continued to drop until a few days after the California Shelter-in-Place order on March 19. From that point on, VMT stayed relatively steady and the next VMT drop appears to occur after most remaining recreational options closed, on April 4. Therefore, compared with the first week (Monday to Sunday) of March, VMT dropped 23% in the second week, 65% in the third week and in the fourth week was 78% less than in the first week. (12)
Since on-road GHGs are directly proportional to VMT, GHGs also have dropped similarly through March. What does this mean for the region? EPIC estimates the 2016 regional on-road transportation emissions to be about 12 million metric tons CO2e (MMT CO2e). If this is roughly the same as would occur in 2020, and if emissions were evenly spaced over the year, then about 1 MMT CO2e would be emitted each month, including in March 2020. Due to COVID-19 orders, about half of this was not emitted (since the drop was gradual from the beginning of March to the end of March) – about 0.5 MMT CO2e, equivalent to about 950 million miles avoided. How does this compare with a regional policy that has 20% of the eligible (13) labor force working-from-home 2 days a week? The COVID-19 effect on VMT and GHGs in just one month gave us about 30% more VMT and GHG reductions than a year-long regional telecommute policy described in our 2009 report.
What lessons can we take from this as our region considers ways to reduce GHG emissions from on-road transportation? First, we recognize that the dramatic drop in VMT is a short-term phenomenon due to extreme measures to curb the COVID-19 pandemic and these levels of teleworking are not likely to continue under more normal circumstances. We also recognize that there are people in San Diego County who don’t own cars, and those who have now lost jobs. Nonetheless, COVID-19 shows us that:
• There are jobs and responsibilities that can be performed from home, and more frequently;
• It is likely that many more people can work from home than we thought because some jobs require a certain amount of desk analysis together with field or non-office work
• Technology is not a barrier to telework – COVID-19 has shown us that virtual meetings are easy and can be effective
Therefore, the current situation creates an opportunity to reconsider telework programs in our region as a long-term policy to reduce VMT and GHG emissions. Working from home is certainly not a panacea for GHG emissions in the on-road transportation sector, but it can be a viable and significant cost effective tool in the tool box of policies and programs to help our region flatten another curve – GHG emissions – and help deal with another potential crisis – climate change.
(1) See next blog post coming soon…..
(2) Assumed a labor force of about 1.6 million after removing those who used mass transit (~3%), used bicycle or walked to work (~4%) and those who already worked from home (~4%) in 2020 and a gasoline emission factor of 0.000527 MT/mile which would be avoided.
(3) Telecommute was defined differently from work-from-home. Telecommute means using technology to achieve the same work as at an office location outside of the home, or it can also include remote work locations closer to the home such that miles commuted can still be reduced. Due to COVID, and for this blog, no difference is made between telecommute and work-from-home.
(4) Though the pandemic is the reason for sheltering in place, it is recognized that many have currently lost their jobs and have been forced to reduce driving.
(5) SANDAG estimated that more than 30% of the jobs in San Diego County were amenable to telecommuting in 2006. This estimate was provided to EPIC in 2008 by SANDAG.
(6) Working-from-home, telework, telecommute are used interchangeably although working-from-home in the ACS survey means self-employed working-from-home.
(7) Hoang, Anthony T., Nickerson, Robert C., Beckman, Paul and Eng, Janie, Telecommuting and Corporate Culture: Implications for the Mobile Enterprise, Information Knowledge Systems Management 7 (2008) 77-97.
(8) https://www.telework.gov/reports-studies/reports-to-congress/2007-report-to-congress.pdf. Downloaded April 16, 2020.
(9) A Current Look at Telework in the Federal Government and Promising Practices to Support a 21st Century Workforce, at https://www.opm.gov/policy-data-oversight/worklife/federal-work-life-survey/telework-insights.pdf, downloaded April 16, 2020.
(10) Telework Coalition, available at, http://www.telcoa.org/id33.htm
(11) The methodology for estimating daily VMT using data from smart phones and vehicle navigation systems validated with traffic counters and embedded sensors was provided upon request by StreetLight Data, April 10, 2020.
(12) We make no difference in VMT drops related to job losses and those who have to stay home but can work-from-home anyway. We are unable to distinguish the different types of VMT.
(13) This was the labor force after removing those who already use mass transit bicycle, walk, or work-from-home, see Note 2.

Pingback: How has Vehicle-Miles-Traveled flattened Air Pollution in the San Diego Region After Covid-19 Shutdowns? | The EPIC Energy Blog
Thank you for this excellent article