
At this time (2018-2019), the region has experienced extremely high rainfall, with reservoirs filled to the brim. But just last year, we were concerned about the lack of rain, how much water we can save, and in that context, how much energy and greenhouse gases are produced when moving water to us here in the San Diego region.
The water-energy relationship first appeared in a 2005 California Energy Commission (CEC) study which stated that the “water-related energy consumption is large — 19 percent (%) of all electricity used in California” (Table 1-1 p.8, CEC 2005). A more recent study (Spang, 2018, UC Davis) found that electricity savings from mandated statewide water conservation measures from July — September 2015 were almost identical to the first-year electricity savings in the period July 2015–June 2016 from energy efficiency investments by all of the state’s Investor-owned Utilities (IOUs) — a dramatic savings. Though this effect was unintended because the purpose of the mandate was to conserve water, it demonstrated the important role that water conservation can play in energy conservation in California.
However, the story about how much energy is used for water may be quite different at the city level compared with the state-level, not least because definitions of water-energy components vary from state to water district to city-level depending on whether it is about water planning or about climate action planning. Previously we showed some general relationships on water-energy especially in the City of San Diego. This post continues and delves deeper into the relationships between water use and energy use at the state level contrasted with that at the city level (San Diego region), the “city” being a common unit used for climate action planning.
Energy Embedded in Water at the State versus City Level
At the state level, the “19% of all electricity used in California” refers to electricity needed for the entire water-use cycle, that is, from water production/supply and conveyance, to treatment, distribution to water end use, and wastewater collection, treatment and discharge (Figure 1).

Figure 1: Components of the Energy Embedded in Water at the State Level
In addition, 32% of the state’s total natural gas is used for water purposes (mostly end-use). The sum of this energy use (both electricity and gas) is referred to as “energy embedded in water.” This “energy embedded in water” converts to about 10% of the state GHG emissions, but this 10% does not feature separately in the state GHG emissions pie chart. (Figure 2, left hand side).
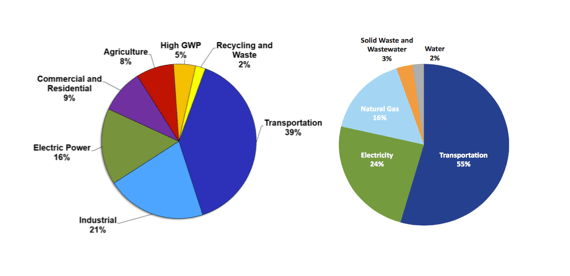
Figure 2: State GHG Emissions by Category 2015 (left hand side) and Typical City GHG Emissions Profile, San Diego Region 2015 (right hand side)
In contrast, at the city level, the GHG emissions pie is categorized differently from the state version and it is based on emissions categories over which cities have some local control, namely, transportation (and land use), electricity and natural gas (from buildings), solid waste (disposed into landfills), wastewater (process and fugitive emissions) and water (conservation and efficiency) (Figure 2, right hand side). Here, we assess the energy-in-water as it is assessed for GHGs in climate action plans. GHGs from water use are defined by the US Community Protocol to include only emissions from electricity (and any natural gas) used to convey and supply water from the source (upstream), treat, and then distribute it up to the end user. Energy from water’s end-use (e.g. water heating) and wastewater treatment energy are by definition not part of the water emissions category and instead form part of the electricity and natural gas category. From a city’s point of view, energy-in-water represents typically 2–9% of the total electricity use of a city, including the upstream component, and about 1–2% of the GHG emissions profile. Climate action plans typically include water efficiency and water conservation measures as energy and GHG emission mitigation measures.
Our research in 10 San Diego cities provides little known insights into the water supply system and energy use by city, and demonstrates a variety of factors for why cities have very different water-related energy use and energy intensities.
Water Use by City and Supply Sources by City
To understand how water and energy are related by city, we first must know where each city gets its water from. San Diego county has 24 water agencies[1] serving 19 jurisdictions (and about 95% of the county population of 3.1 million, the rest being served by private agencies and wells) through one major wholesaler — the San Diego County Water Authority (SDCWA).

Figure 3 San Diego County Water Authority Water Supply Portfolios with Projections
SDCWA’s main water supplies are the Colorado River and the State Water Project (SWP) purchased through the Metropolitan Water District (MWD). The water may come directly from MWD, or indirectly through the All American and Coachella Canal Lining, or the Imperial Irrigation District Transfer agreement. SDCWA supplies each retail agency with either wholesale raw (untreated) water or treated water. SDCWA’s supply portfolio is shown in Figure 3. While the supply choice increases over time, even in 2035, the majority of this water (70%) is expected to originate from the Colorado River and the State Water Project.
A city’s supply will generally reflect the SDCWA supply portfolio unless it is able to draw on its own local water supplies, such as surface and groundwater, or recycled and desalinated water. For this study, we obtained data from suppliers for 10 cities, shown in Figure 4, for the period 2010–2015. As can be seen, the service area of a retail water agency may cover part of a city, a single city, or parts of several cities leading to overlapping suppliers by city and ensuing complications to come up with values on a city-basis for the energy use (and GHG emissions) of water supply.

Figure 4 San Diego County Water Authority’s Water Districts and Associated Cities.
When we do unravel the water supply sources by city, we find unsurprisingly that most cities depend overwhelmingly on imported supplies (Figure 5). Of the cities studied, National City in 2010 came closest to a 50:50 split between imported and local supply. However, the availability of local supply depends not only on rainfall but also on whether rainfall can be captured in reservoirs. Currently, the region’s reservoirs are located in the east of the county. Therefore, in 2010, with the highest (normal) rainfall during the period 2010–2015, the water districts supplying National City, Chula Vista, Escondido, and Vista were able to benefit from capture of this rainfall. However, in 2015, a drought year, these cities lost significant amounts of local supply. In 2010, with normal rainfall, Escondido had 32% of its water from local surface water, which decreased to 4% in drought year 2015. Chula Vista had 15% local water in 2010 and 8% in 2015. We can expect water supply portofolios for these cities in 2018–2019 to be similar to that in 2010.
Another type of supply which reduces the need for imported water is recycled water, which six of the ten cities in this study — Chula Vista, Del Mar, Encinitas, Escondido, San Diego and Solana Beach — provided during 2010-2015 (Figure 5).[2] Chula Vista had 13% recycled water in its portfolio in 2010, and 14% recycled water in 2015. Del Mar had 6% recycled in 2010 and 12% in 2015.
Note that there are significant variations across cities in the per capita water use per day (Figure 5). Reasons for the differences in per capita have not been assessed but may reflect socio-economic conditions.

Figure 5 Water Supply Portfolios and Per Capita Use by City
Upstream Energy-for-Water
As explained above, for climate planning purposes at the city level, the energy-for water is equal to upstream supply and conveyance energy from the source through MWD to SDCWA, the local treatment energy of raw water, if any, and the distribution energy to end users.
Because each city has different suppliers, a city’s energy use for local treatment and distribution depends completely on the supplier’s portfolio and treatment options. However, since all retailers purchase most of their water from SDCWA, the upstream supply and conveyance portion depends only on the state water project and Colorado River energy and GHG intensities. Both raw and treated water are purchased from MWD. According to SDCWA, in 2005 and before, the ratio of treated to raw water purchased was about 60% to 40%. Strategy changes were undertaken to shift this ratio towards more untreated water so that in 2015, treated water imports were about 25% of the total.
A comparison of estimates for the upstream (non-local) supply and conveyance energy intensity outside of a retail agency’s operational control are provided in Table 1. The latest estimate developed by EPIC for this study is based on those reported by MWD and SDCWA.
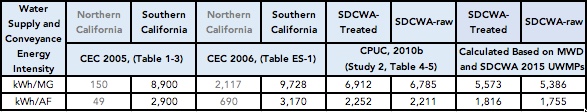
Table 1 Estimates of Upstream Water-Energy Intensities for SDCWA
As shown in Table 1, the upstream energy intensity for SDCWA treated water are somewhat lower than the SDCWA-treated and SDCWA-raw energy intensity reported previously in a 2010 CPUC Study 2, demonstrating the importance of more regional analysis for the water system. [3]
Although upstream energy intensities are generally used as constants for climate planning purposes, the amount of water delivered through Colorado River and SWP varies by year, depending on hydrology, weather patterns and other issues. As a result, the energy intensity for upstream supply and conveyance could vary by year even while it remains the largest component of each section of the water-energy cycle (Figure 6).

Figure 6 Total Energy Use by Source, San Diego Region, 2010-2015
Absolute Energy Use and Energy Intensities by City
The absolute energy use ranges by city for moving water is shown in Figure 7 excluding the city of San Diego because its absolute value is so much greater than that of other cities in the region.

Figure 7 Total and Local Energy Use Ranges by City
Among the remaining cities, the total and local energy use are highest for Chula Vista which is also the second largest city of those studied. However, the energy intensities for water by city tell a different story from the absolute energy use by city shown above. Where the city of San Diego used the most energy totally and locally, its energy intensity now falls to within the average of the cities studied, whether total or local. The lowest energy intensity in 2015 (total and local) was in National City indicating that National City may be more water-energy efficient due to its greater use of local supply in that year. However, the efficiency of water use will also depend on the system’s engineering and topography and without an assessment of each of these by city, and by year, it is difficult to assess and compare water-energy efficiencies across cities.

Figure 8 Water energy intensities by city, San Diego region, 2015
What does more rain like in 2018–2019 do to this relationship? We can expect that those cities with more local storage capacity will require less imported water now and in the coming year, and that their total energy intensity will decrease compared with drought years, and compared with cities which have no such capacity. It remains to be seen how these energy uses and energy intensities translate to GHG emissions and GHG emissions intensity by city, which will be shown in the next post on this issue.
(With significant input on calculations, graphs and tables from Yichao Gu, EPIC).
[1] Energy-for-Water Nexus in Cities in San Diego County (October 2018).
[2] City of San Diego’s data were not shown in the figure because of the scale and City of Solana Beach’s 2015 water use data were not available.
[3] 6 cities, 5 water districts, 8 municipal districts, 3 irrigation districts, one public utility district and one federal military reservation. San Diego County Water Authority Member Agency.

Some of the raw data on energy use for water conveyance in the literature is gross rather than net (excludes energy recovery from the generators in the system). Would be useful to know if that is the case here. Note that Carlsbad is excluded and not sure how the study takes account of the 34MW 24hr/day energy use of the Poseidon plant. Also, Carlsbad uses lots of recycled water.
I am not sure I ever responded, so sorry! The upstream energy use (conveyance) is net. The Poseidon plant was excluded at that time as we did not have the data
We distinguish between upstream conveyance (that is upstream of SDCWA) and conveyance from SDCWA to the local retailers and from the local retailers to the cities (local conveyance) whereby the distinction between the energy used for production of the water (for example if it is from groundwater) and the conveyance is not clear in most cases. In any case, the energy use for conveyance is net of hydropower produced.
Yes Carlsbad was not part of this study. the desal plant was also not yet online in 2015. If we are able to update this study in future, we will be including the desal energy used for treatment. Note that most of the desal water is sent to SDCWA as a supply source, and then mixed with other water sources before distribution. As such the energy use for desal will be one of the energy uses contributing to the SDCWA treatment energy. In 2017 the desal suply to SDCWA was 9% of its portfolio.
Hey Dr. Nilmini Silva-Send,
Thanks for sharing this valuable information to us.
Keep sharing.
Thanks for the detailed data